|
||
|
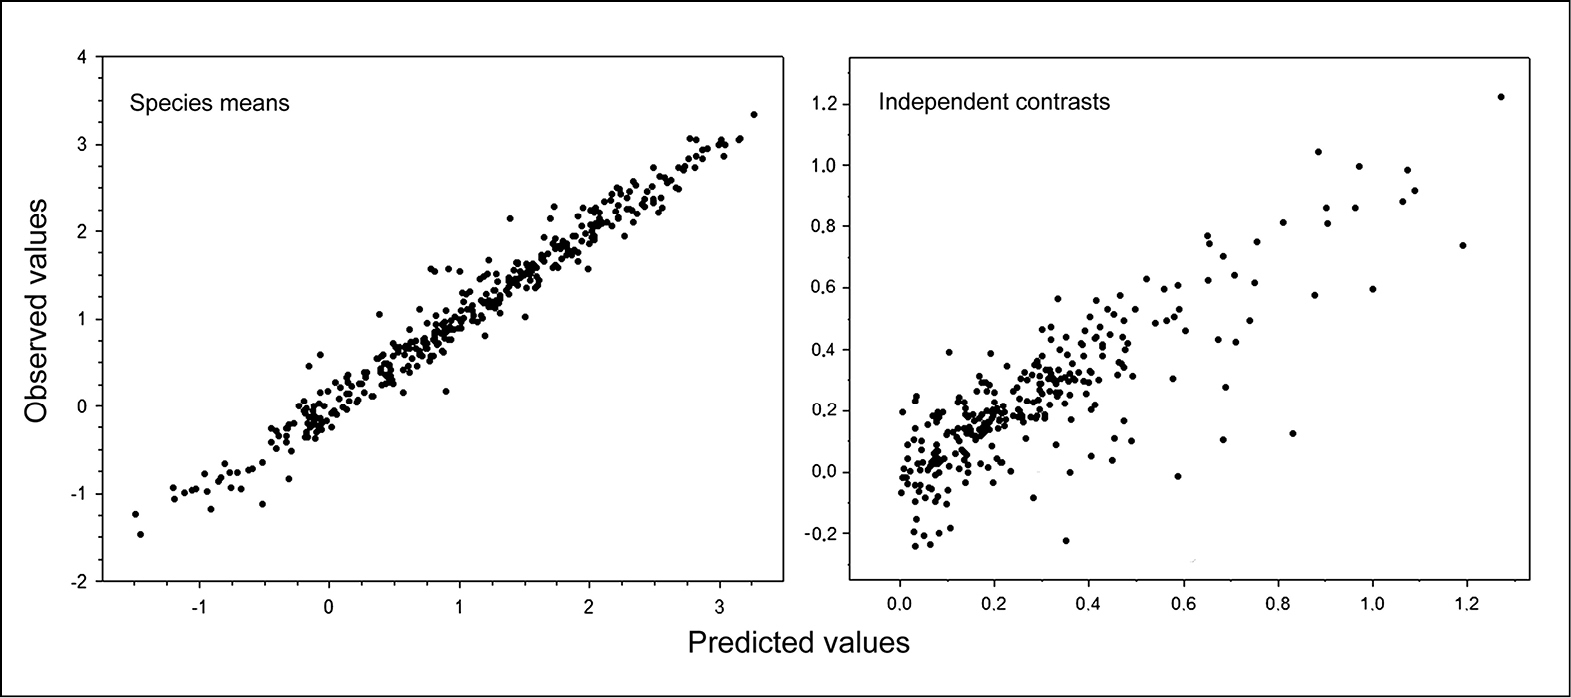
Dispersion plots illustrating the fit (predicted on observed weights) of the two multivariate models of highest R2 scores based on the raw species data (above) and the independent contrasts (below) (respectively, models 1 and 2 in Table 4). |
|
||||||||
| Part of: García-Barros E (2015) Multivariate indices as estimates of dry body weight for comparative study of body size in Lepidoptera. Nota Lepidopterologica 38(1): 59-74. https://doi.org/10.3897/nl.38.8957 |